As part of NACSA’s 2015 annual survey, we asked authorizers for their perspectives on overseeing and holding schools accountable for school discipline practices. We asked about what they do during the application process, what they do when problems are uncovered, and more. We encourage you to explore the full data release: Authorizing Data in Depth: School Discipline.
As the field of authorizing matures and becomes more sophisticated, a number of authorizers are instituting school discipline oversight systems that aim to protect student and public interests while maximizing and upholding school autonomy. One such approach, that has a heavy emphasis on promoting transparency, is being pioneered by the District of Columbia Public Charter School Board (DC PCSB).
We invite you to read about DC PCSB’s Equity Reports, including what they are, how they have been used, what has happened with suspension and expulsion rates since their implementation, and why other authorizers should consider using them.
An Honest Approach to School Discipline
By the District of Columbia Public Charter School Board
In 2012, many elected officials in Washington, DC believed public charter schools were “skimming” and “dumping” students to get higher proficiency and growth scores on state assessments. Accusations included intentionally denying access to students with disabilities and counseling out or expelling students in vast numbers (e.g., removing students after the official public school enrollment count and before the state assessments cycle, expelling students long-term).
To shed light on these allegations, DC PCSB convened public charter school leaders to come up with a variety of comparable measures for all public charter schools. After a series of meetings, the traditional school district, state education agency, and City education leaders agreed to work collaboratively to create DC’s first “Equity Report.”
This report, now published annually, dispelled the myths that public charter schools force students out and do not serve students with disabilities. It also found that the city’s public charter schools were losing fewer students over the course of a school year than traditional public schools. Additionally, the report data showed that the long-term suspension rates of public charter school students was not higher than traditional public schools.
What are Equity Reports?
In Washington DC, equity in education refers to all students receiving the same caliber of education regardless of their race, ethnicity, economic status, special education status, or other factors.
Equity Reports give schools, families, and communities transparent and comparable information related to equity across all DC public schools (both charter and district-run schools). Metrics displayed on the annual reports include:
- Demographic enrollment (broken out by race/ethnicity, English Language Learners, special education status, gender, income, and grade level);
- Attendance;
- Suspension;
- Expulsion;
- Middle of the year withdrawal and entry;
- Four and five-year graduation rates; and,
- State assessment, proficiency and yearly growth.
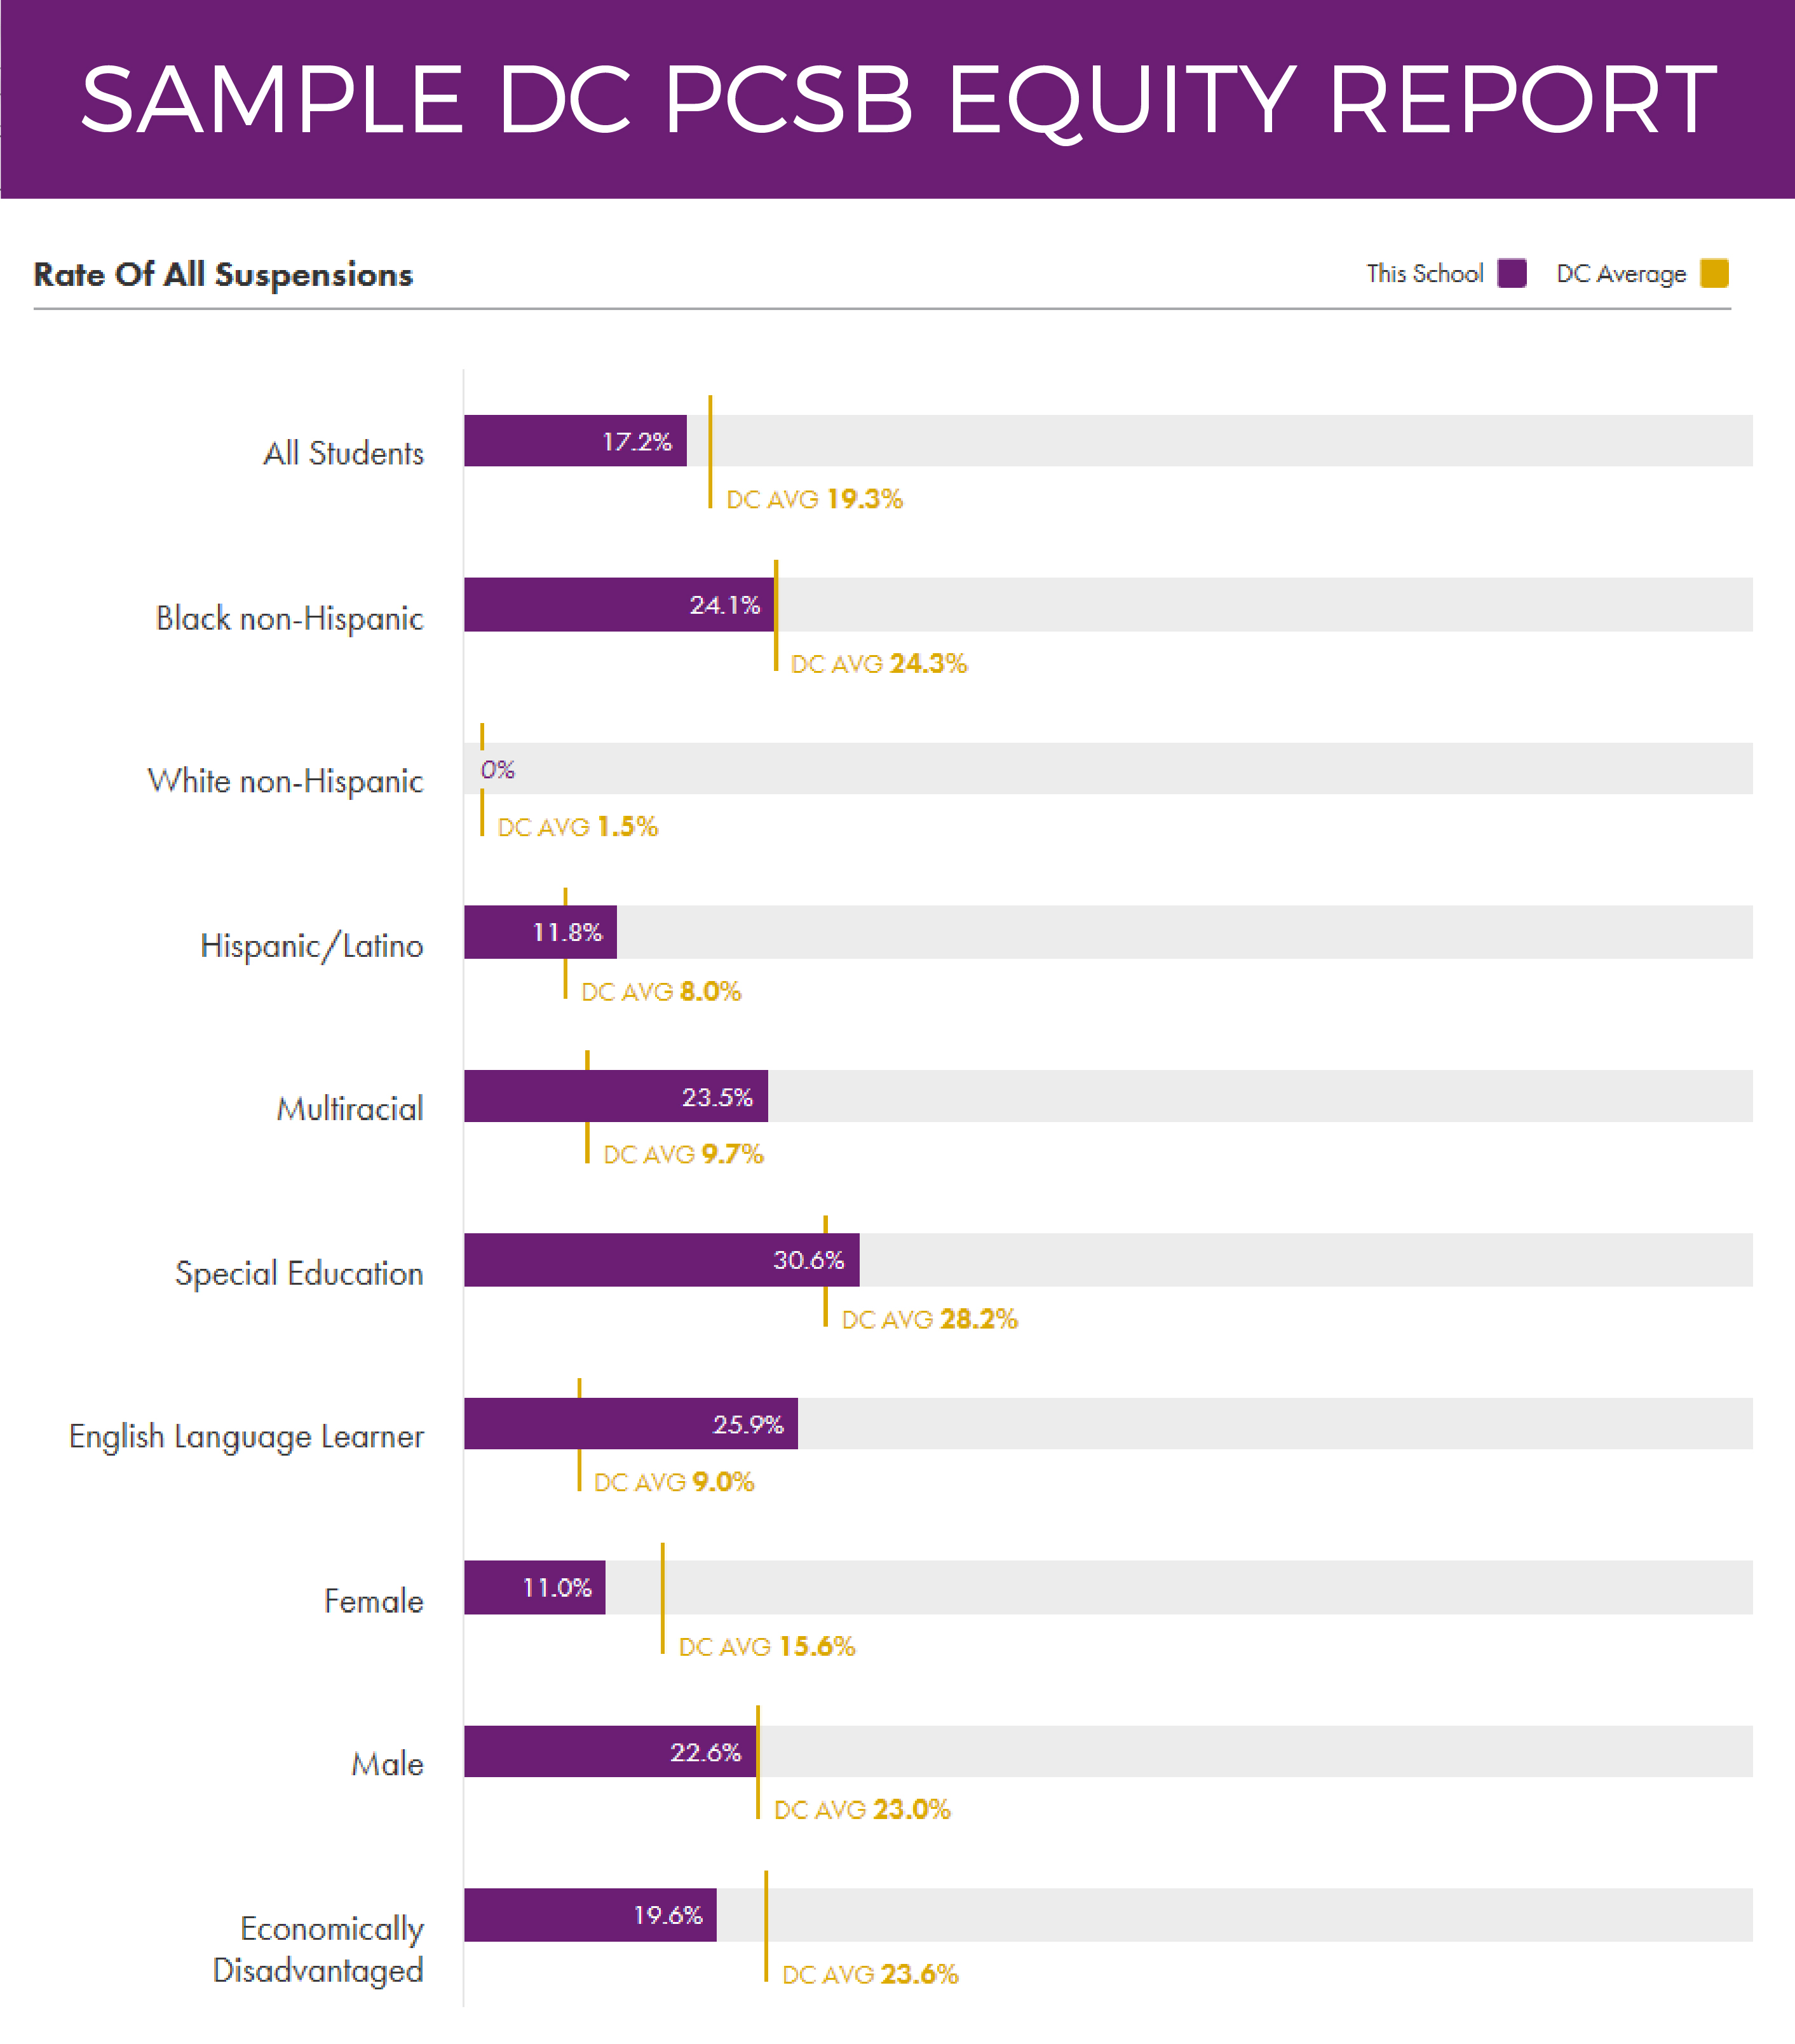
Individual reports for each school are generated, with metrics displayed by subgroup (see F). Data show the school’s rate on those metrics compared to the citywide average of all public schools (charter and traditional) in the city. The citywide comparison is shown by grade band for the majority of metrics.[1] Equity reports for DC’s charter schools can be found here.
What do Equity Reports do, if anything?
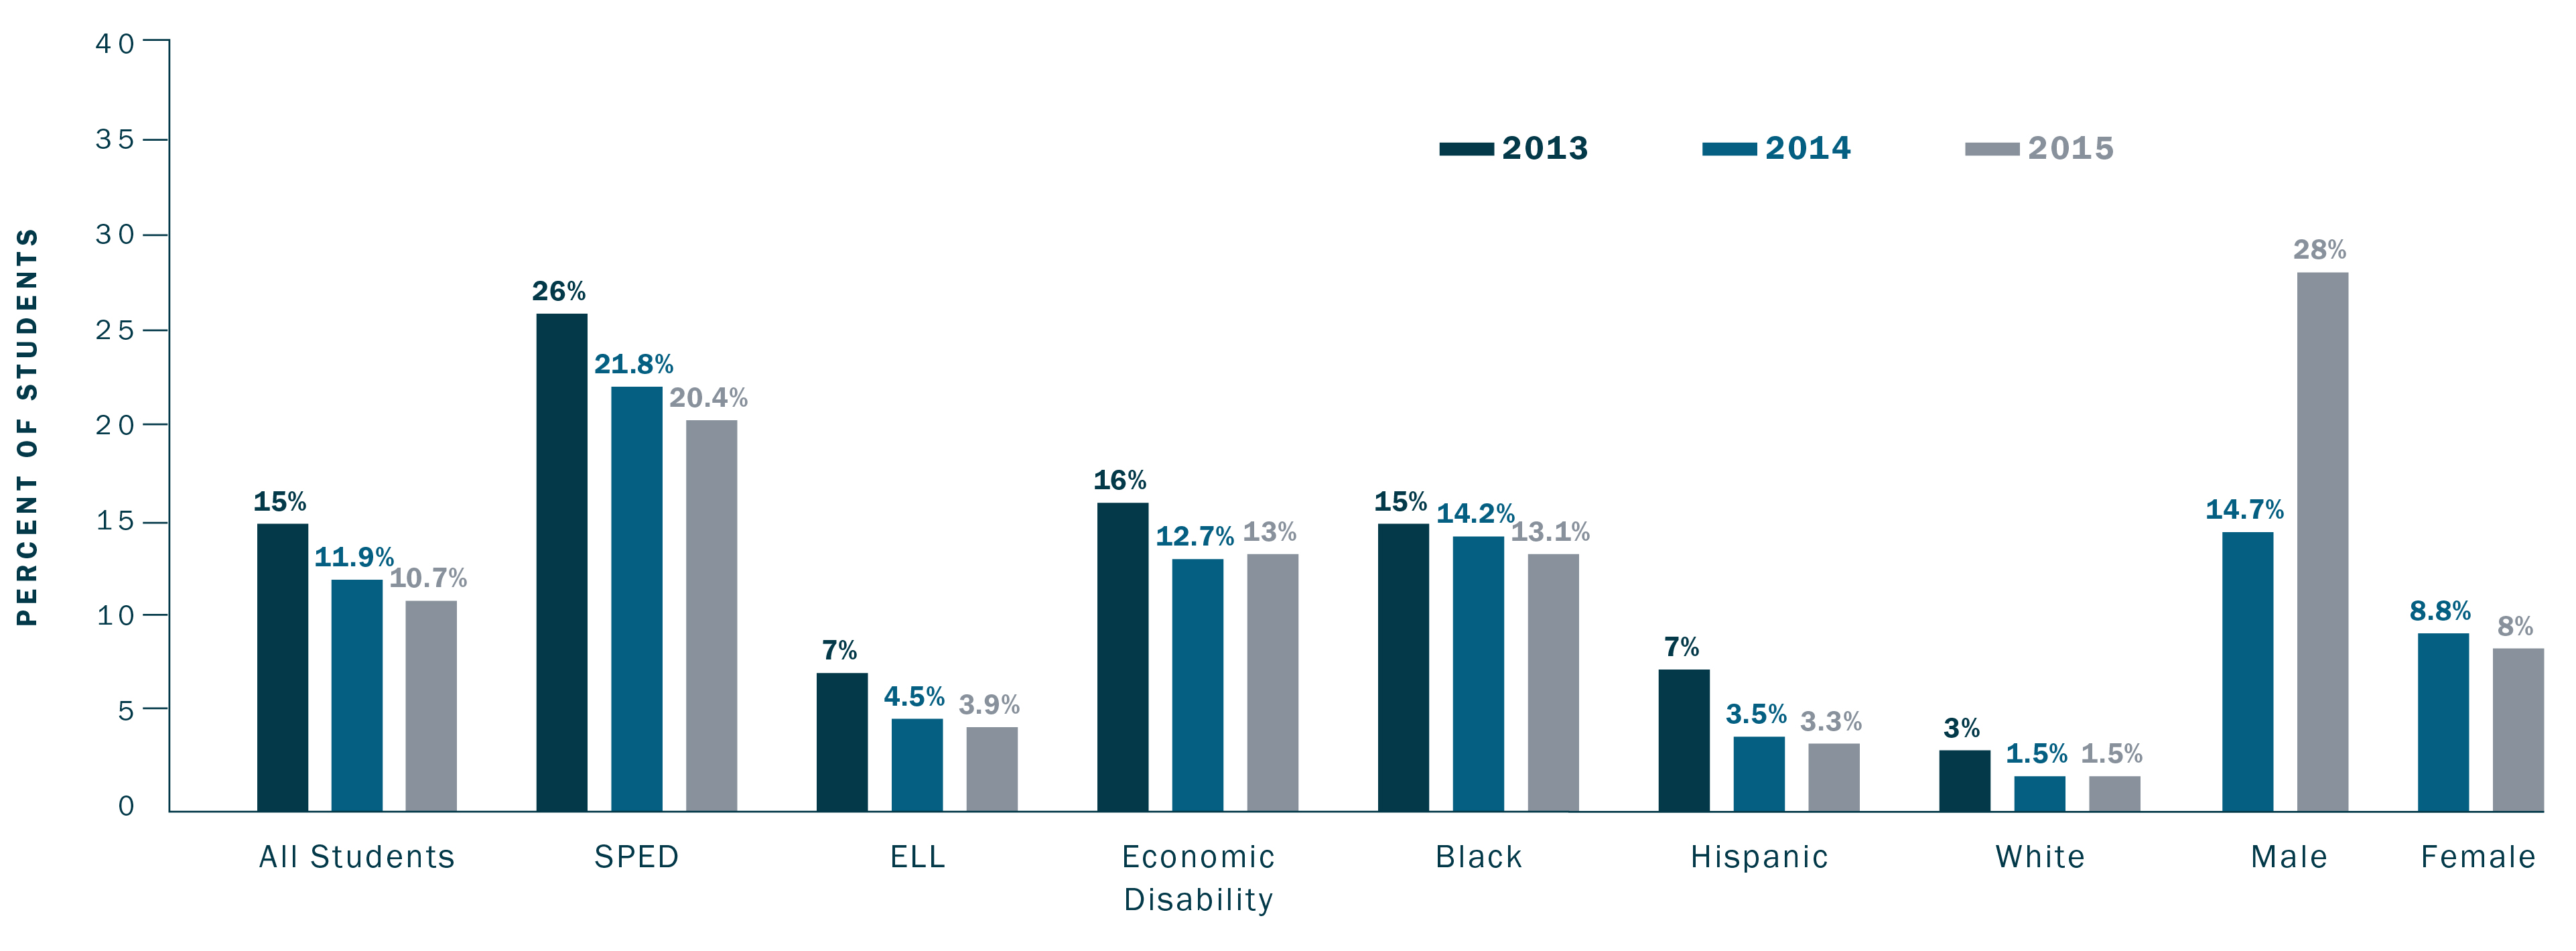
The Equity Reports provide DC elected officials, parents, and others with unprecedented amounts of data about each school in the District. Equity Reports, along with other interventions we have instituted (e.g., Mystery Caller Program, Board to Board Meetings), coupled with an increased focus on areas in need of improvement by school leaders has produced promising outcomes, including a three-year decline in suspensions and truancy for almost every subgroup. As the chart below illustrates, we have seen the overall percent of students suspended drop nearly 30 percent—and the drops hold across student subgroups.
Additionally, expulsions have declined nearly 63 percent (0.8 percent of students during the 2011–12 school year to 0.3 percent in 2014–15).
Percent of Students in Charter Schools With 1+ Day Suspension
We publish these trends annually on our website.
What are the Benefits of Equity Reports?
Our approach focuses on student outcomes and doesn’t require a single behavior modification, allowing us to avoid intruding in school decisions about operational and behavioral programs. We believe it is important for schools to find the best approaches and programs for their instructional models and target student populations.
This approach also allows us to eliminate the one-size-fits-all model, resulting in a diverse network of charter school programs that offer families a full spectrum of school models, from “no-excuses” to “whole child.”
Equity Reports equip families with the information they need to make informed decisions and find the school that is the best fit for their child, not only academically but also culturally. That’s especially important in Washington, DC, which is one of the five top cities for school choice.
Why you should try!
Equity Reports encourage transparency, equity, and choice. Using enrollment, suspension, and attendance data (that schools must already report to the Office of Civil Rights and Ed Facts, and often have to report to state Departments of Education), authorizers should be able to easily get those data without additional burden to schools and can make the data publicly available in an easy-to-understand format. Transparency, along with high-stakes accountability, is a pillar of a vibrant charter movement and essential to quality authorizing.
We believe that Equity Reports and other approaches emphasizing transparency are smart and effective methods of allowing families, school boards, school leaders, policymakers, and others can use to protect student and public interests without inappropriately infringing on school autonomy.
[1] For the citywide rate, a grade band specific comparison is shown for attendance, suspension, expulsion, and graduation. The citywide comparison on the state assessment graph reflects all grades, and there is no citywide comparison for demographic enrollment.