We spend plenty of time talking about the why and how of our work, as we seek to ensure more high-quality, innovative, and equitable educational opportunities for children. But every few years, it’s critical that we also talk about the who. Who is doing the work of charter school authorizing today, how is that changing, and why does that matter?
We’re pleased to present Authorizing by the Numbers, a comprehensive study of the numbers and types of authorizers, the size of their portfolios, and how authorizing has changed from 2016 to 2020.
Thank you to the National Alliance for Public Charter Schools for their partnership with data collection.
LEGEND
Types of Authorizers
NEG: Non-Educational Government Entity
NFP: Nonprofit Organization
SEA: State Education Agency
HEI: Higher Education Institution
ICB: Independent Chartering Board
LEA: Local Education Agency
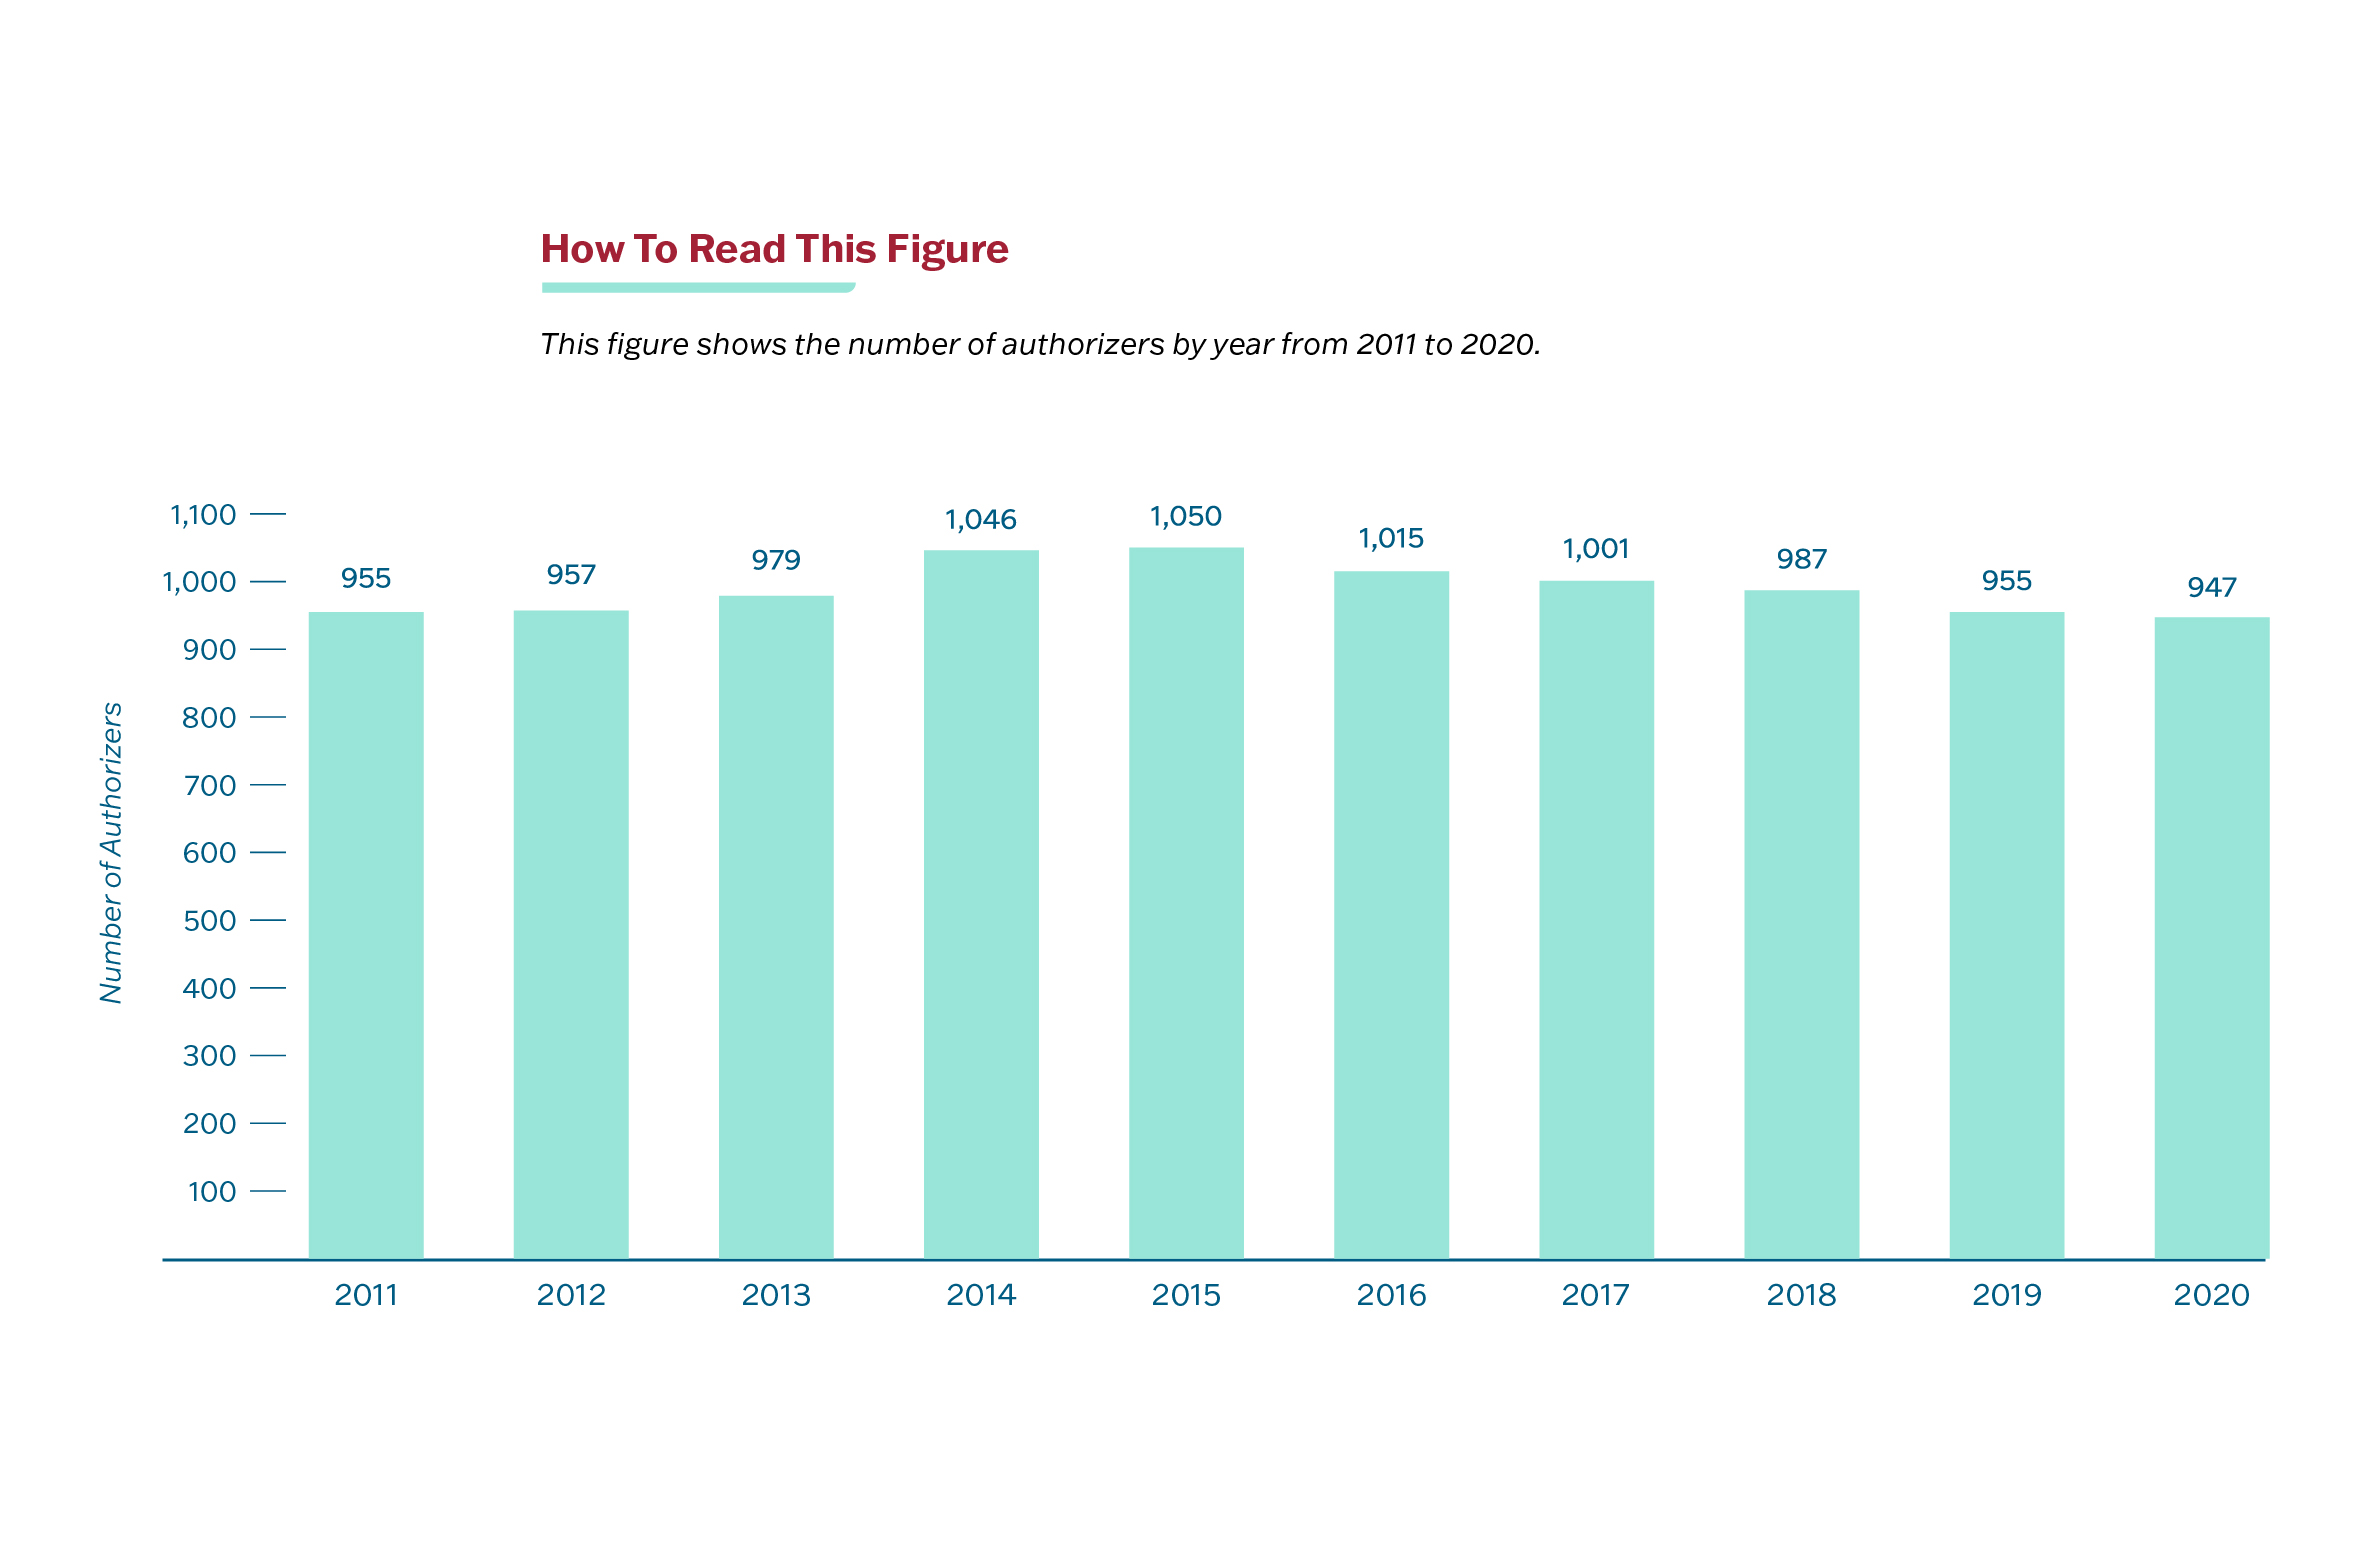
Fewer authorizers oversee more charter schools, and the data suggests that’s generally a good thing.
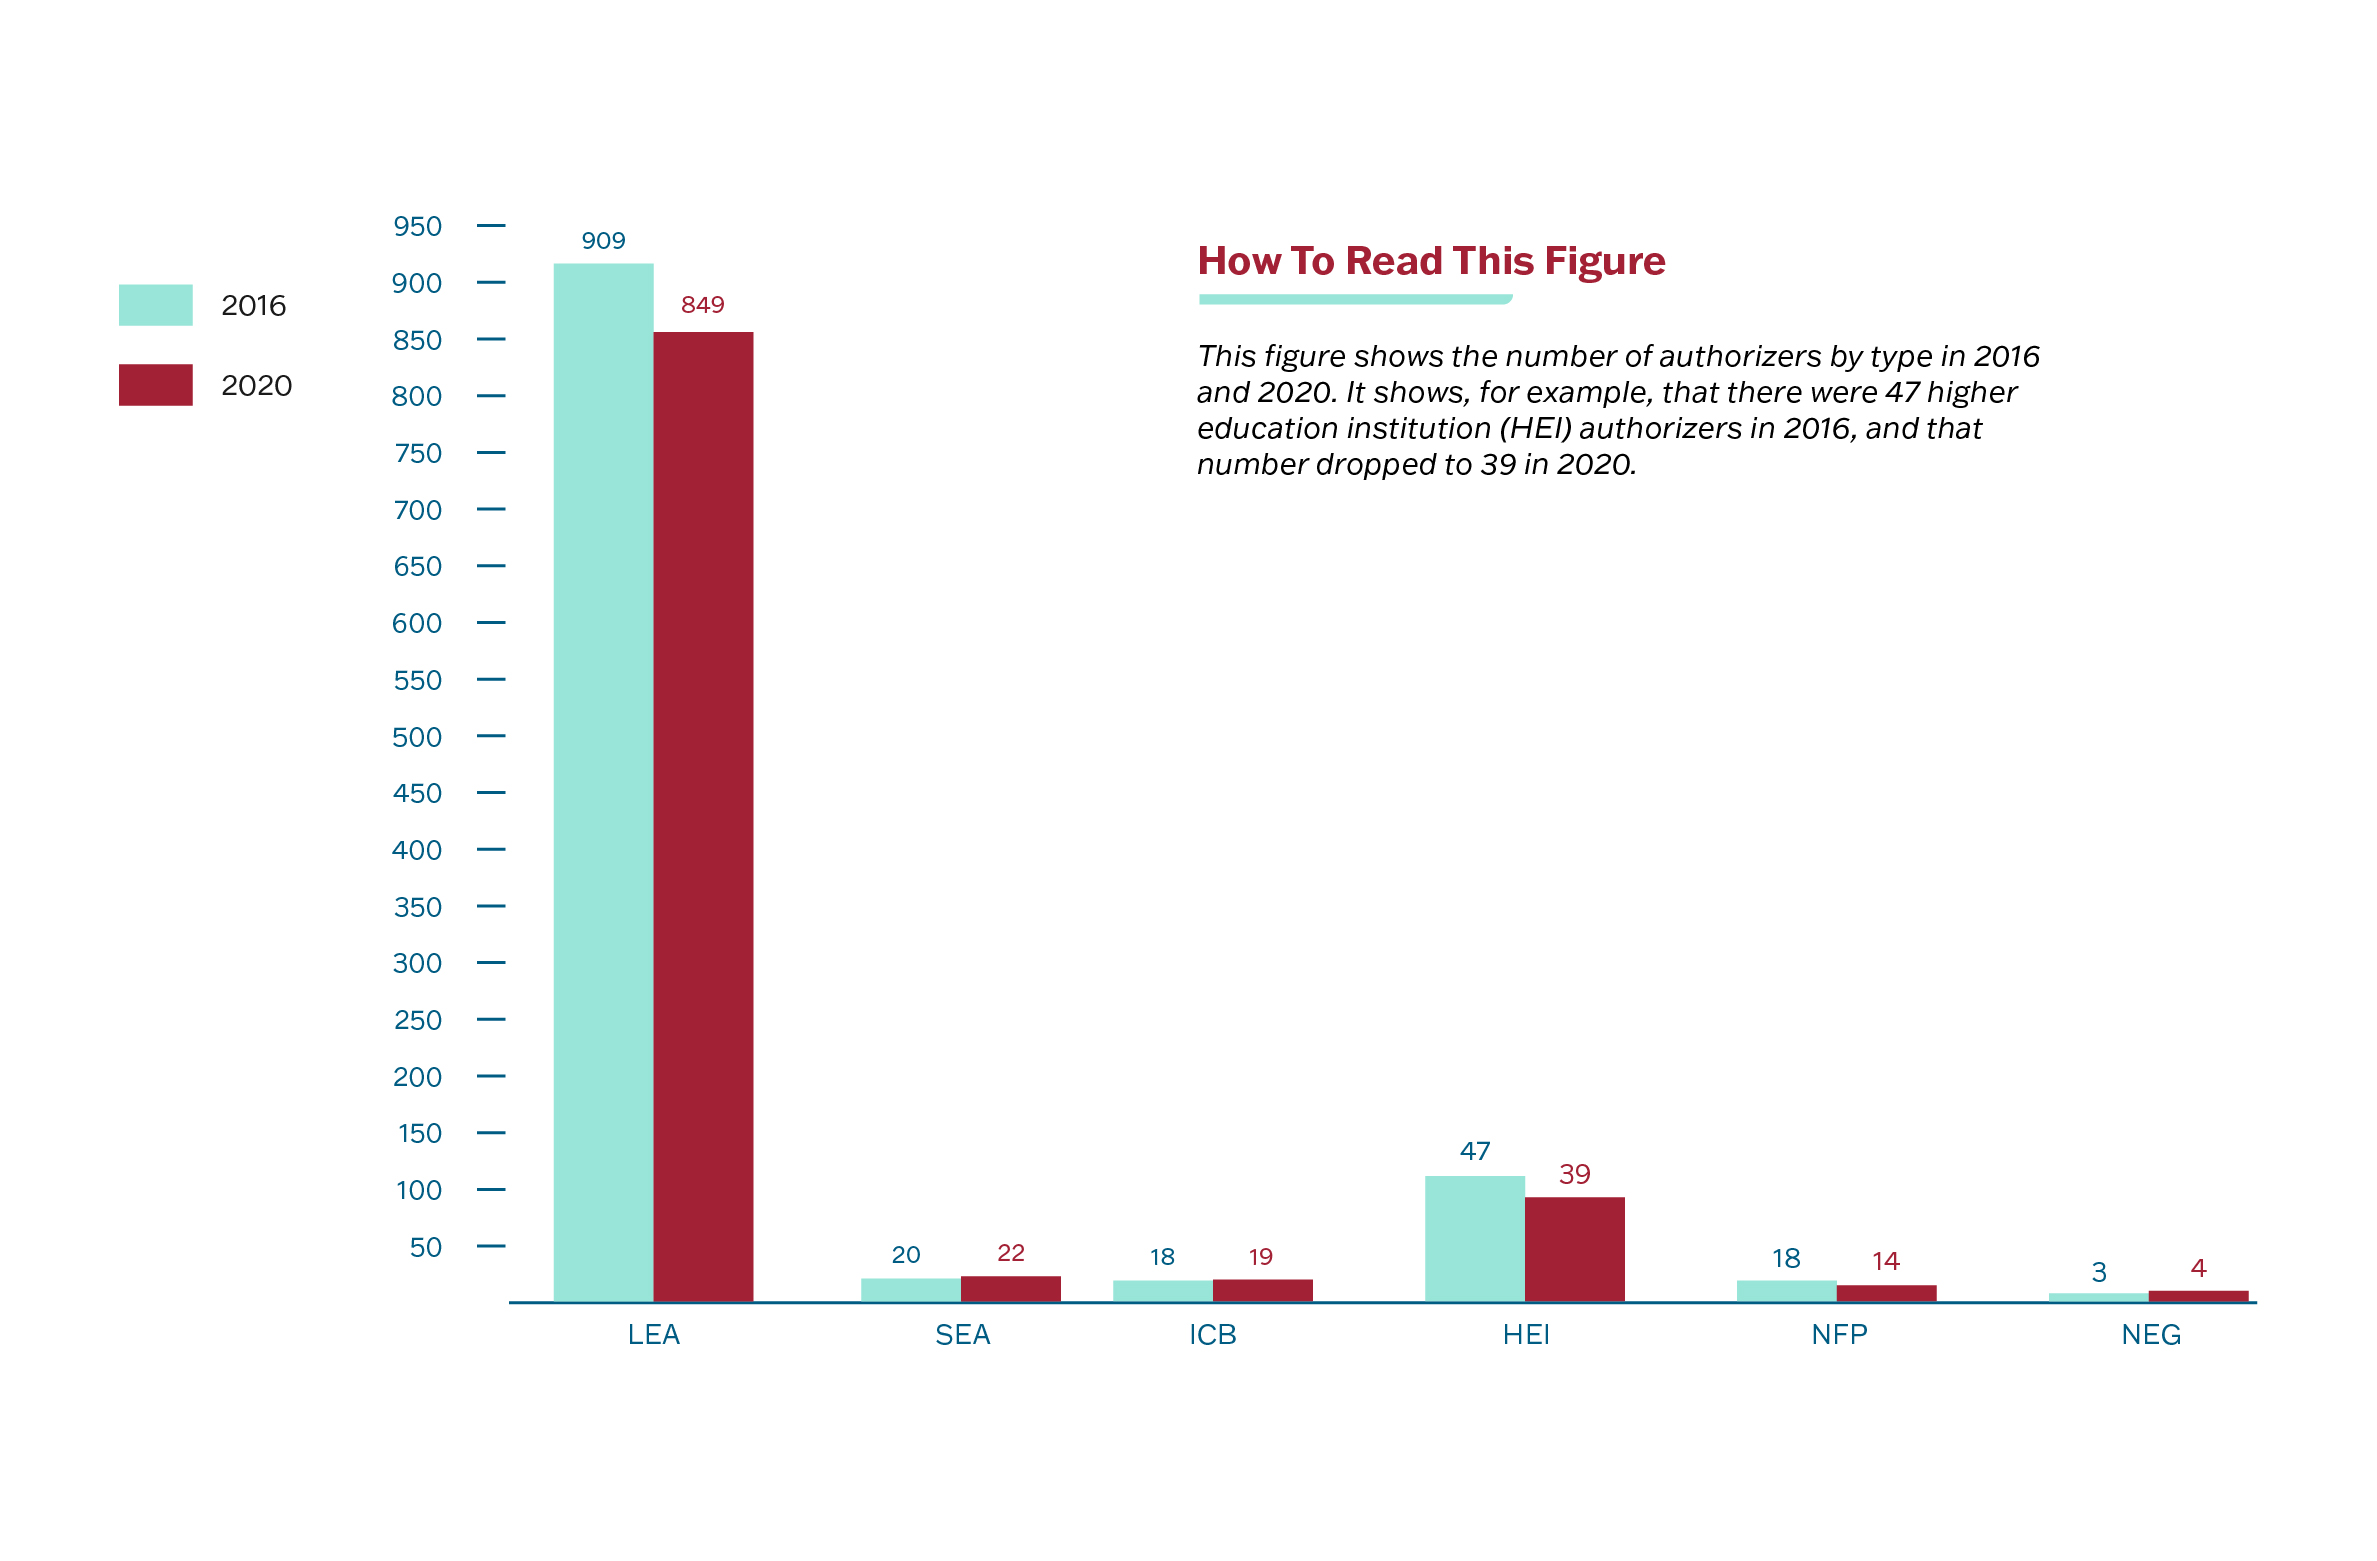
There were nearly 70 net fewer authorizers in 2020 compared to 2016, but remaining authorizers oversee a growing charter school sector. It’s also notable that there are some additional Independent Charter Board (ICB) and State Education Agency (SEA) authorizers, as those types of authorizers have grown their portfolios of schools more rapidly than other authorizer types.
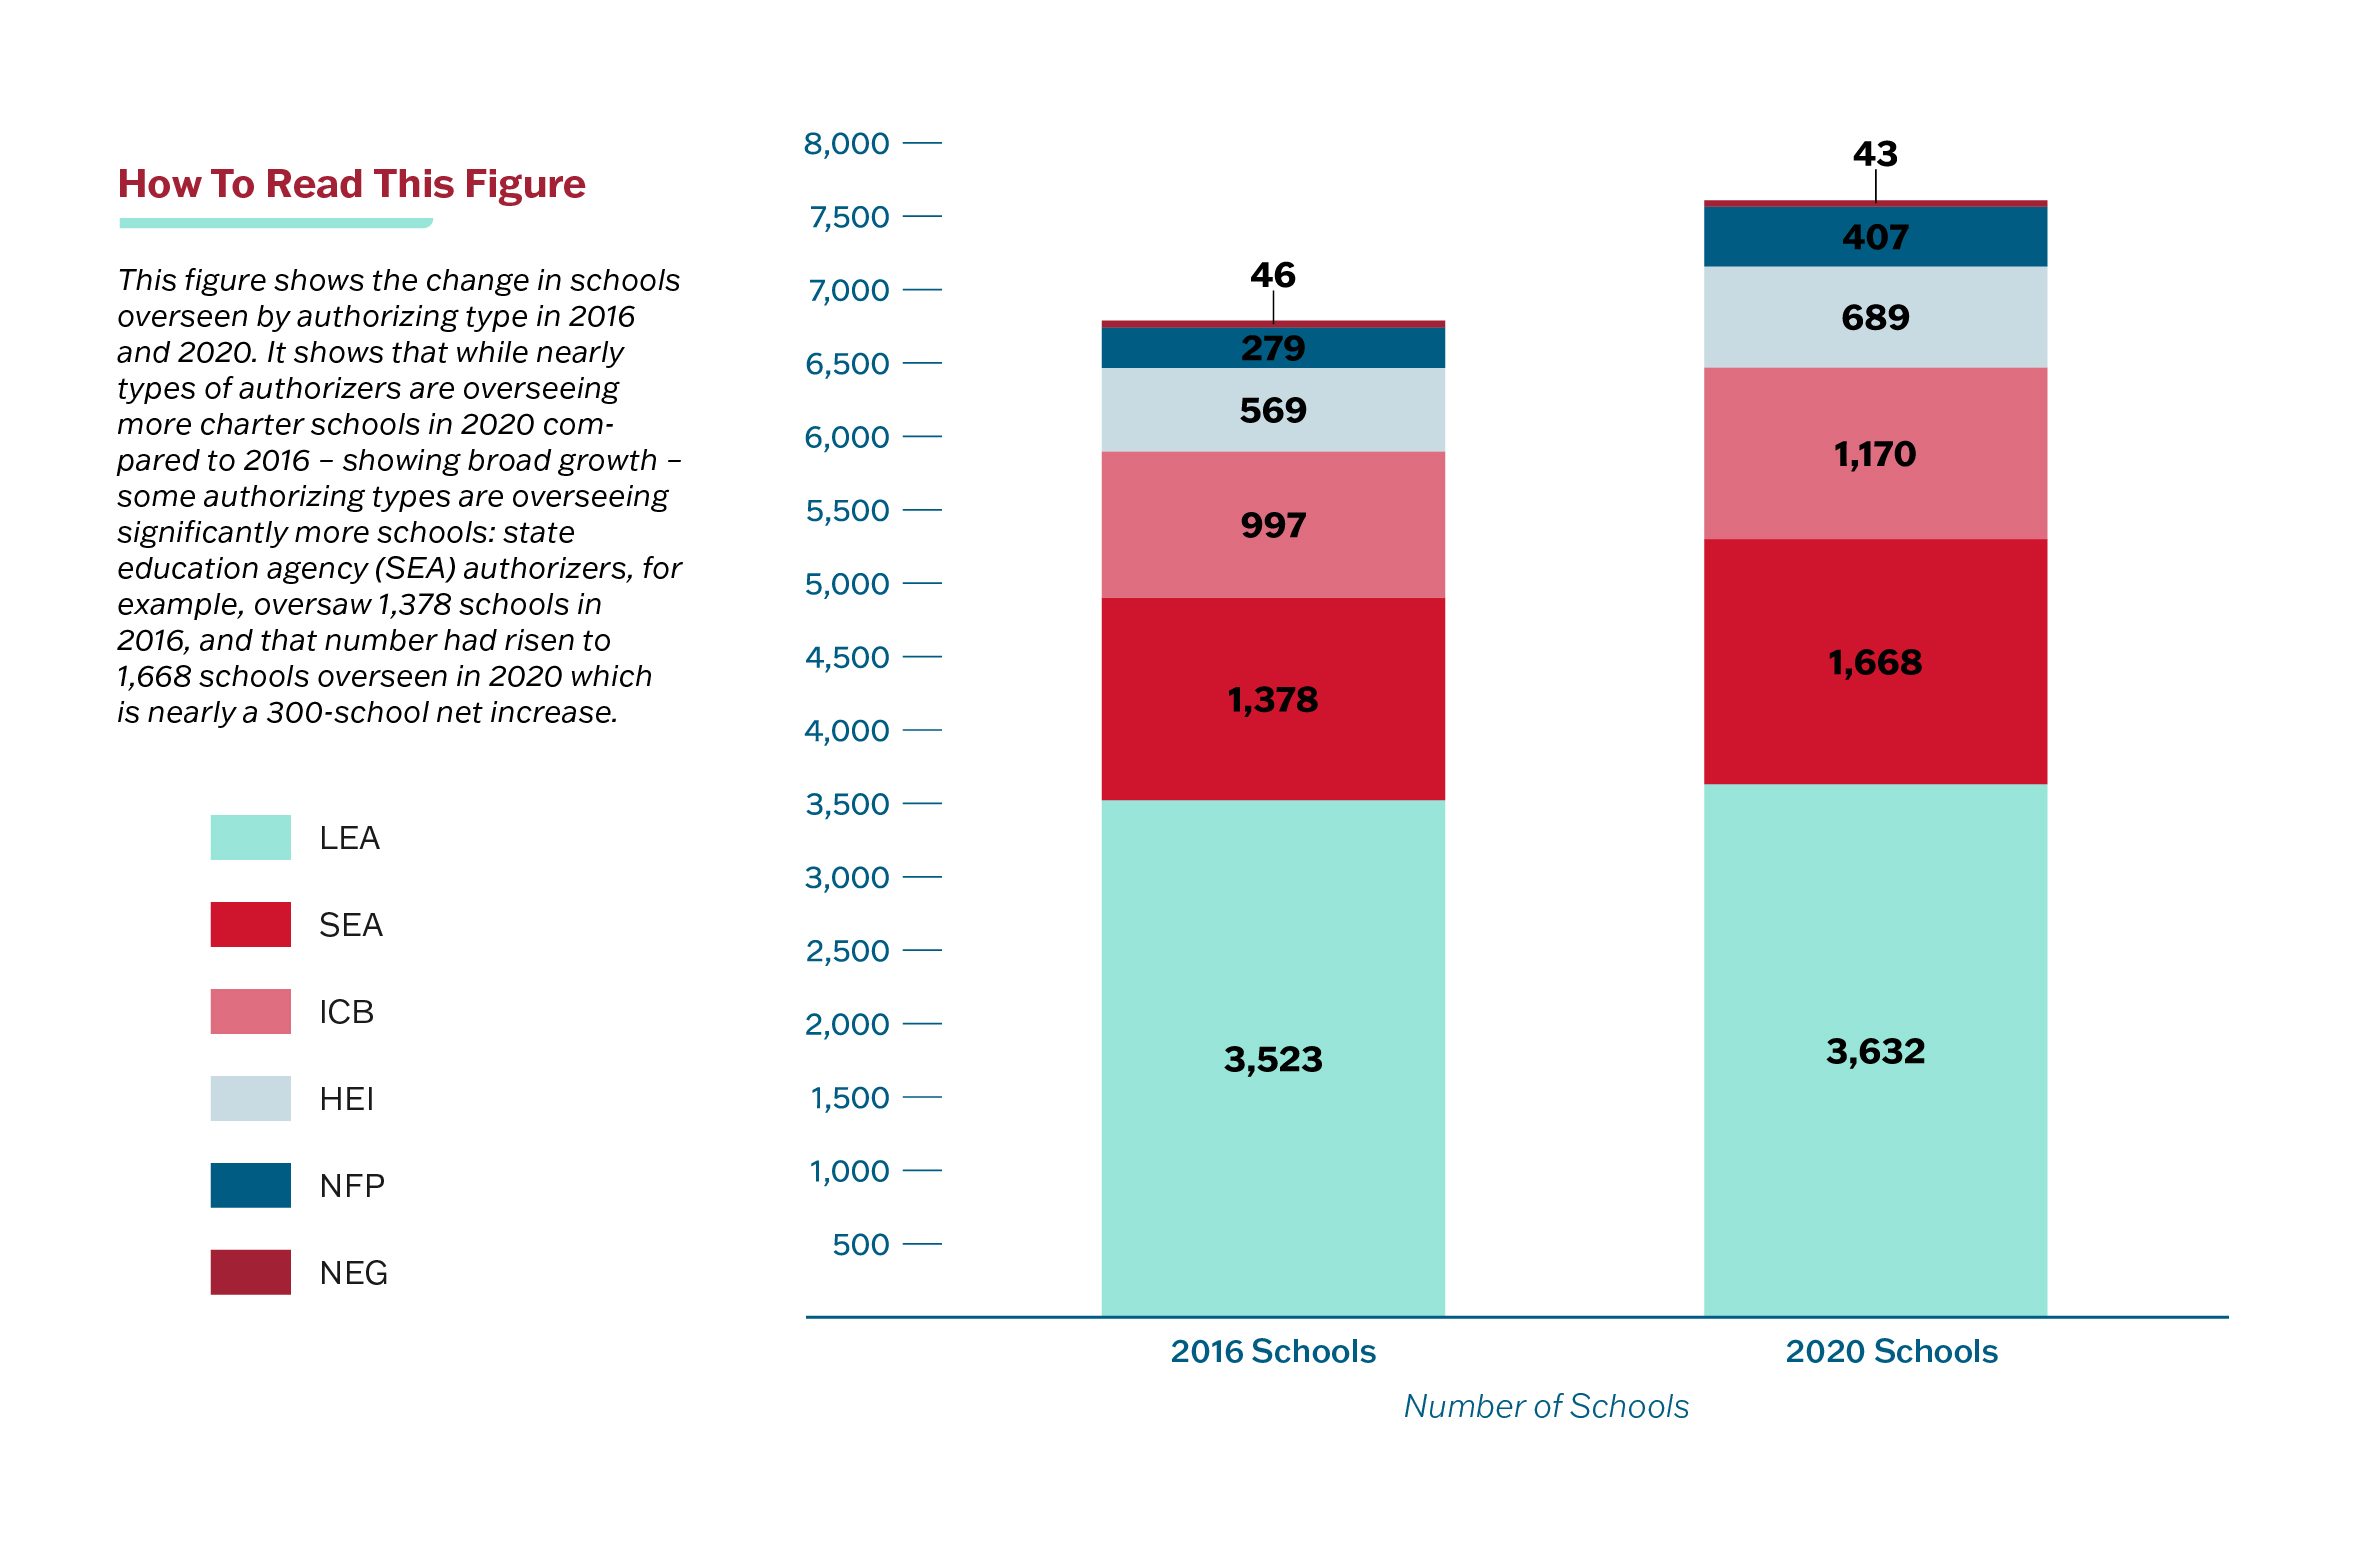
Where is Charter School Growth Coming From?
Number of Authorizers Over Time
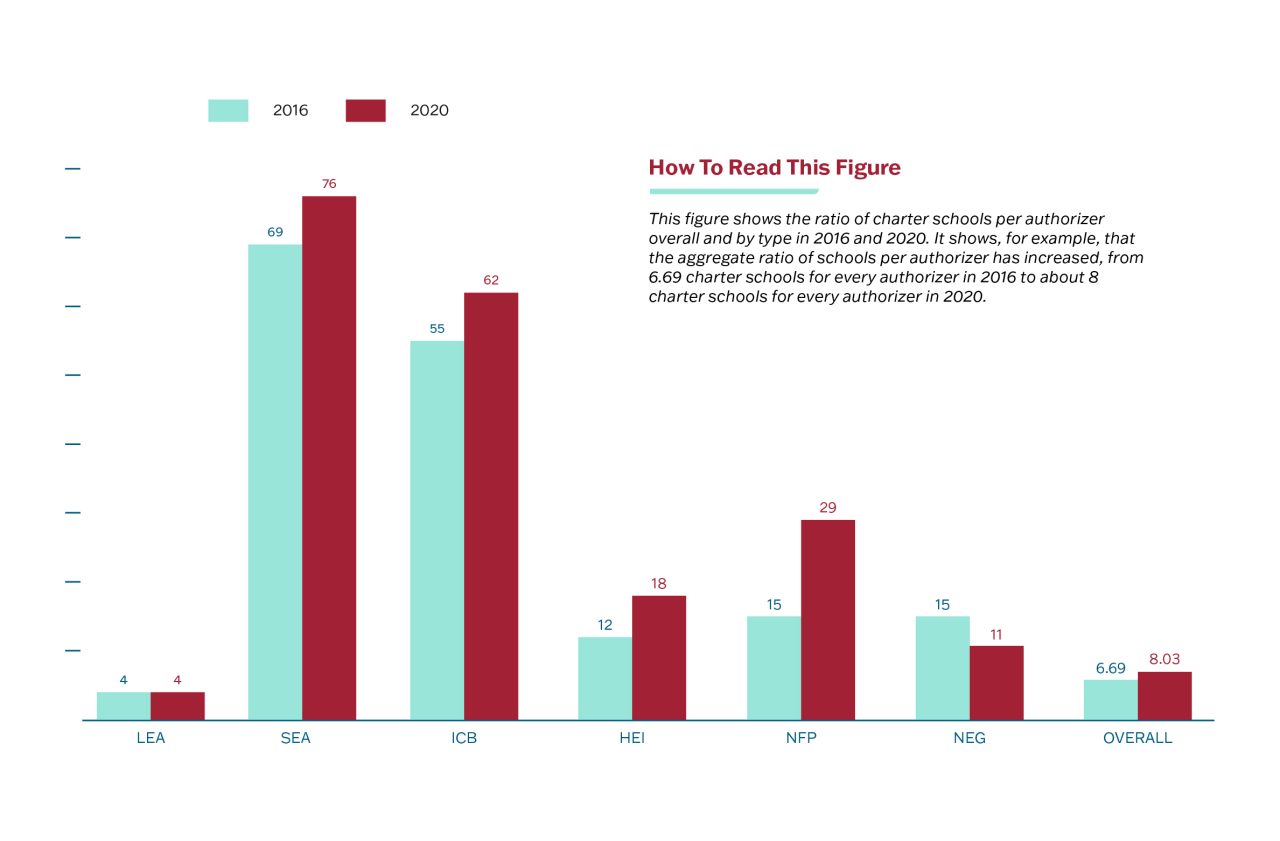
Rate of Authorizors to Schools Overseen by Type in 2016-2020
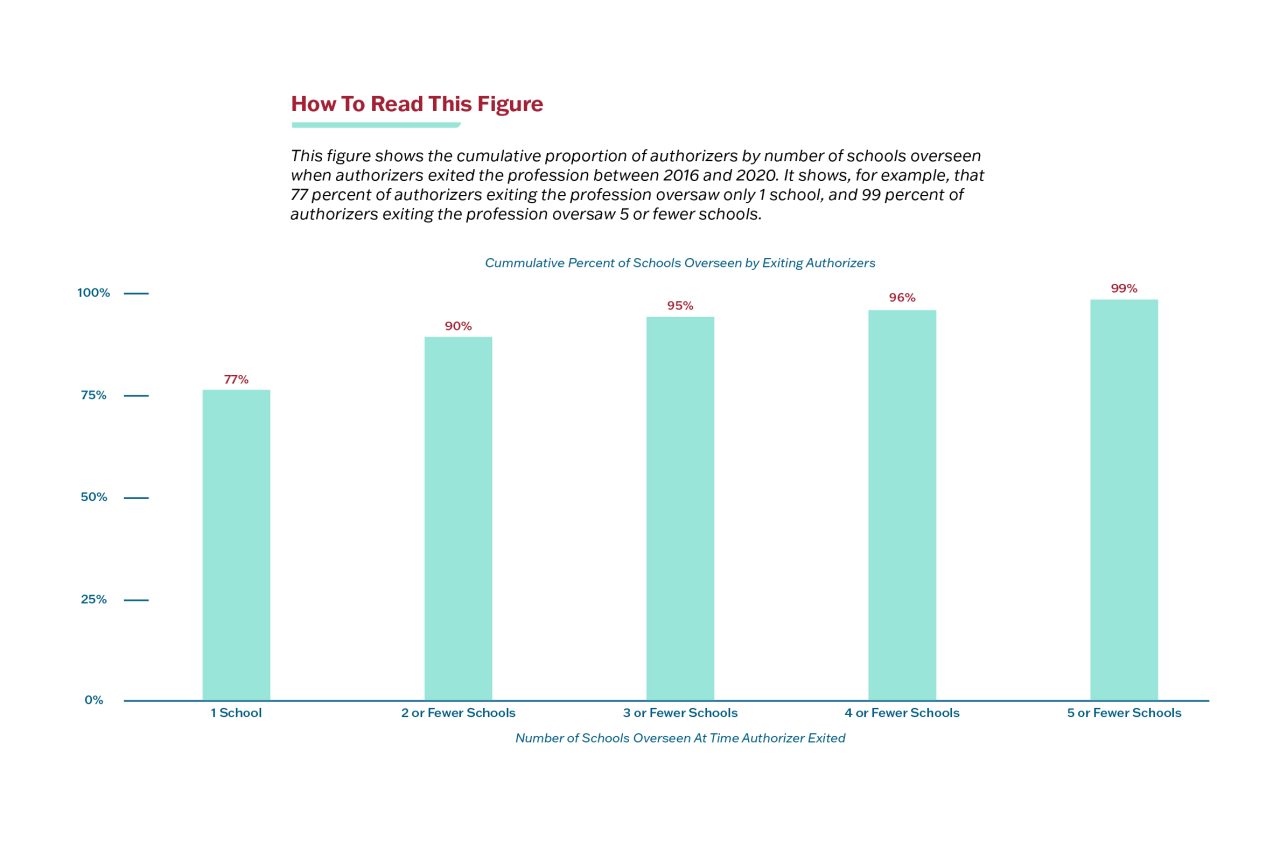
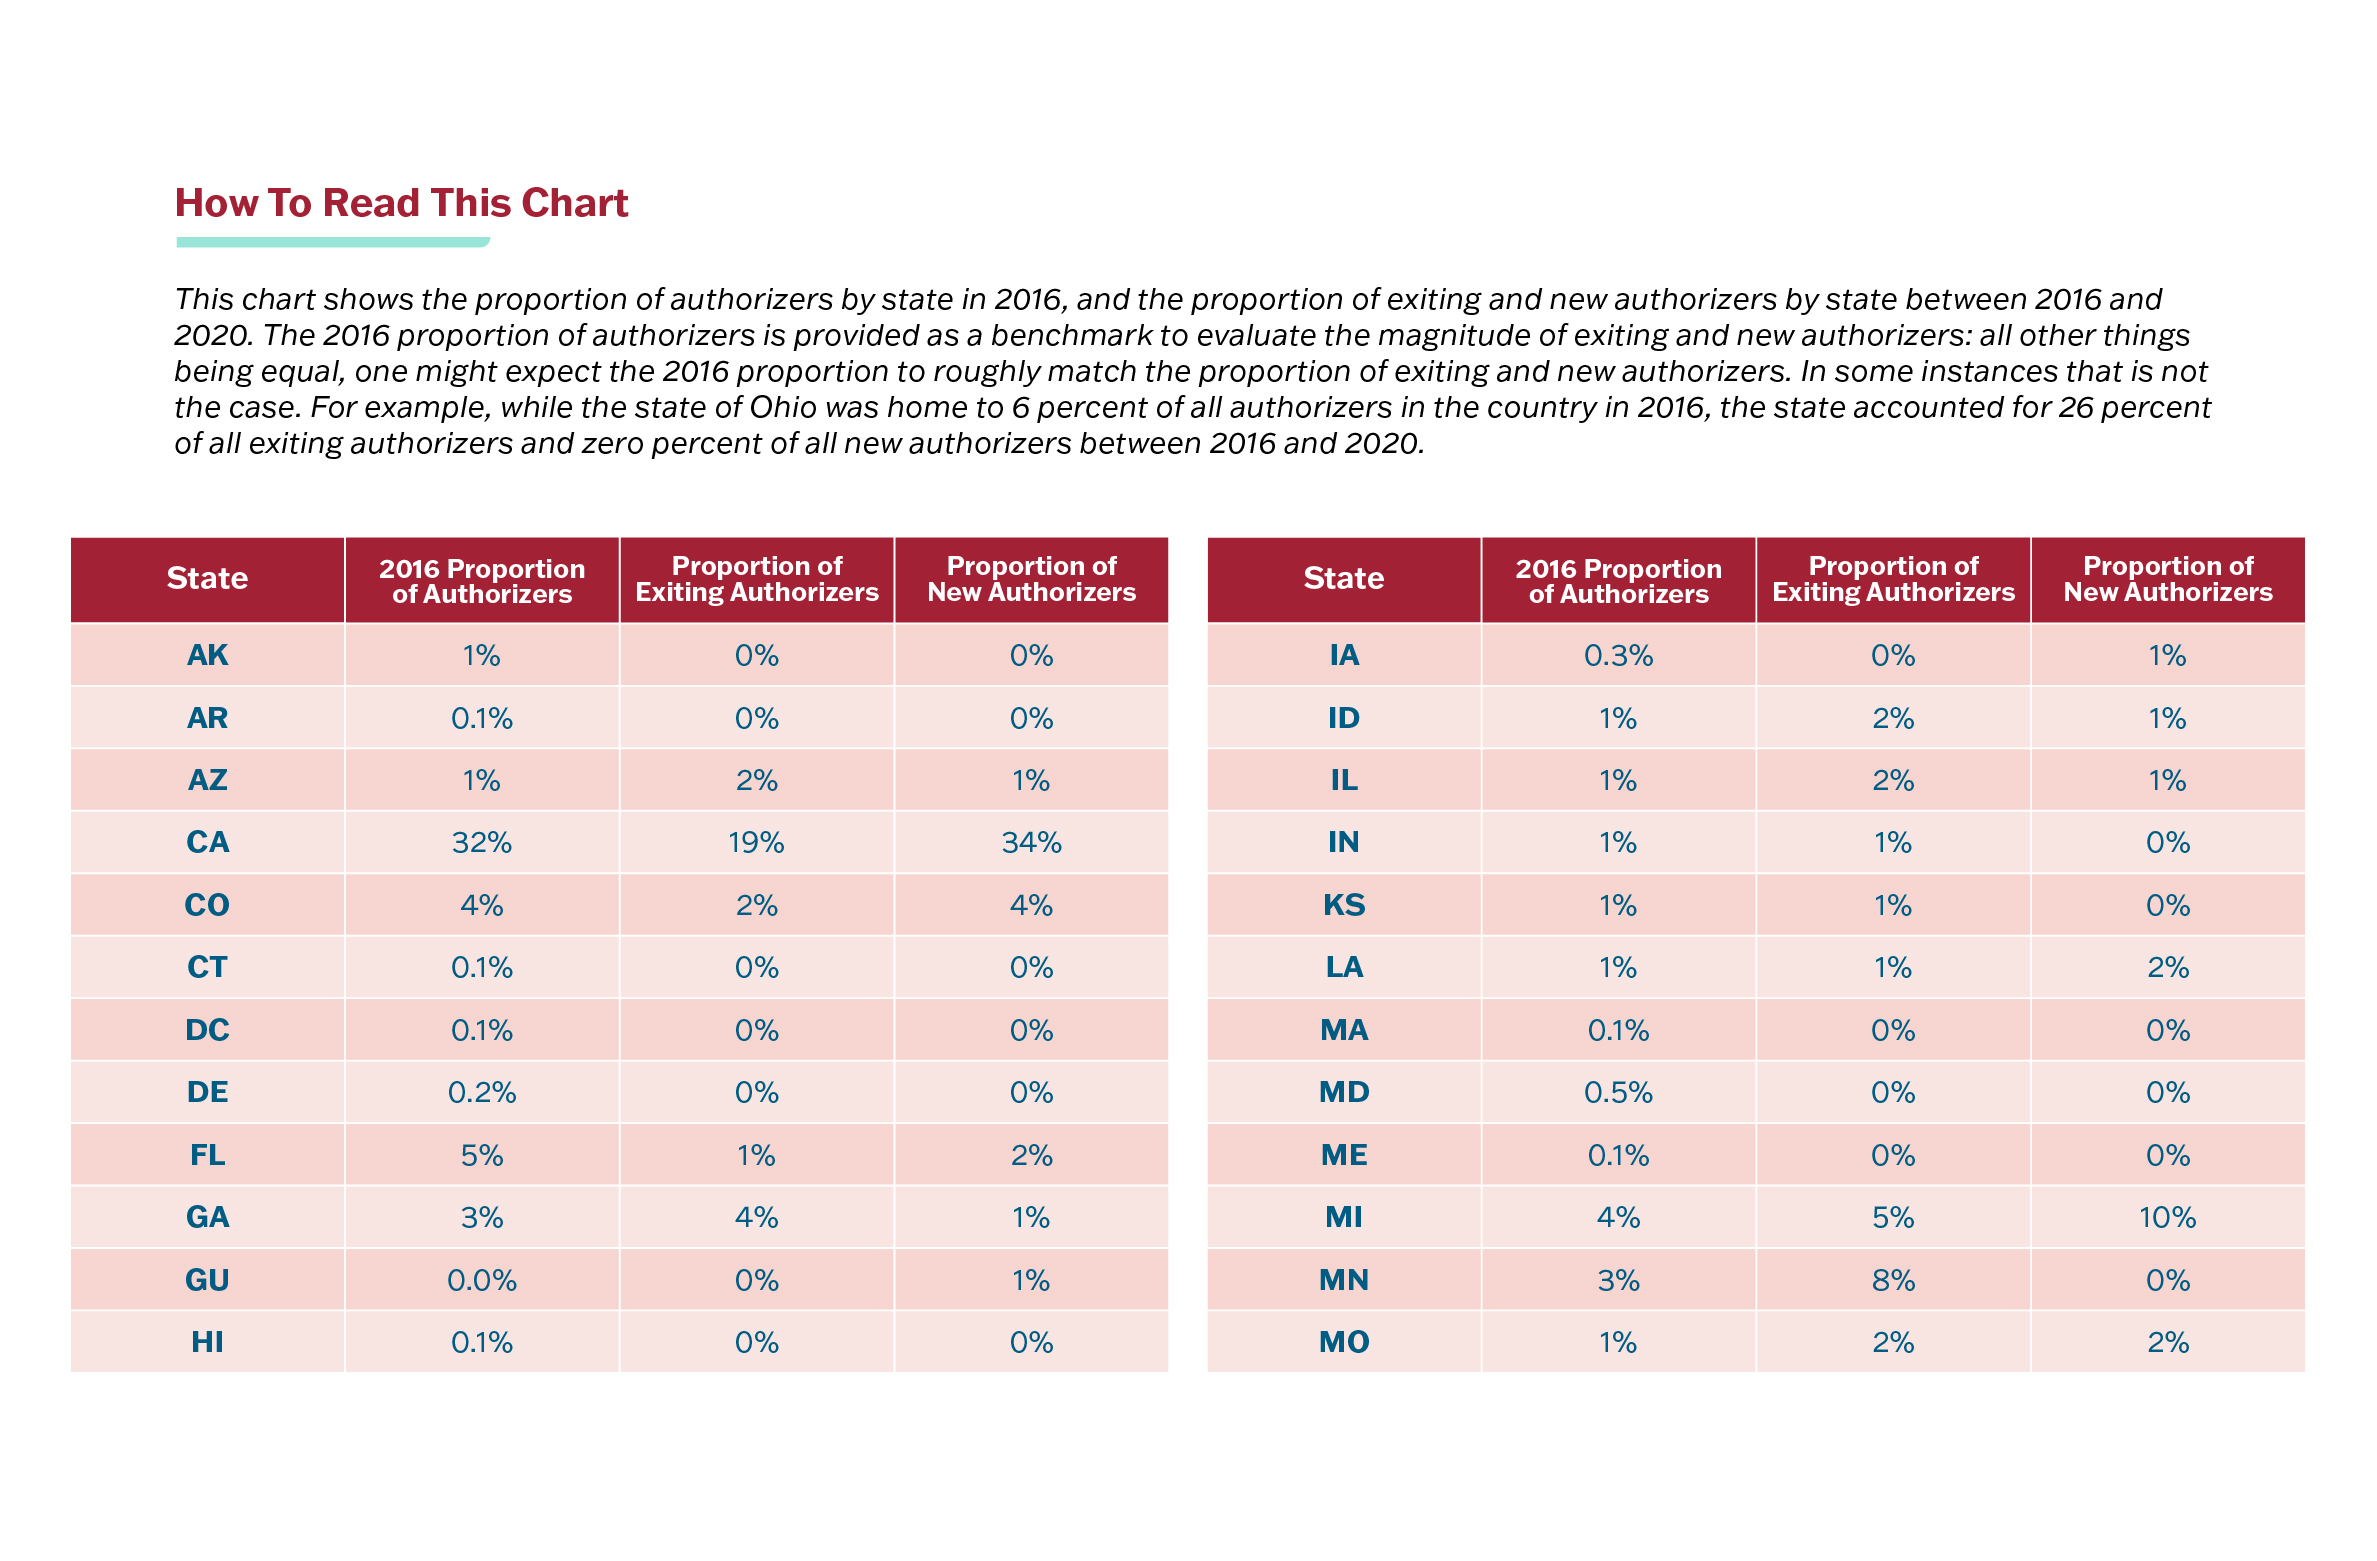
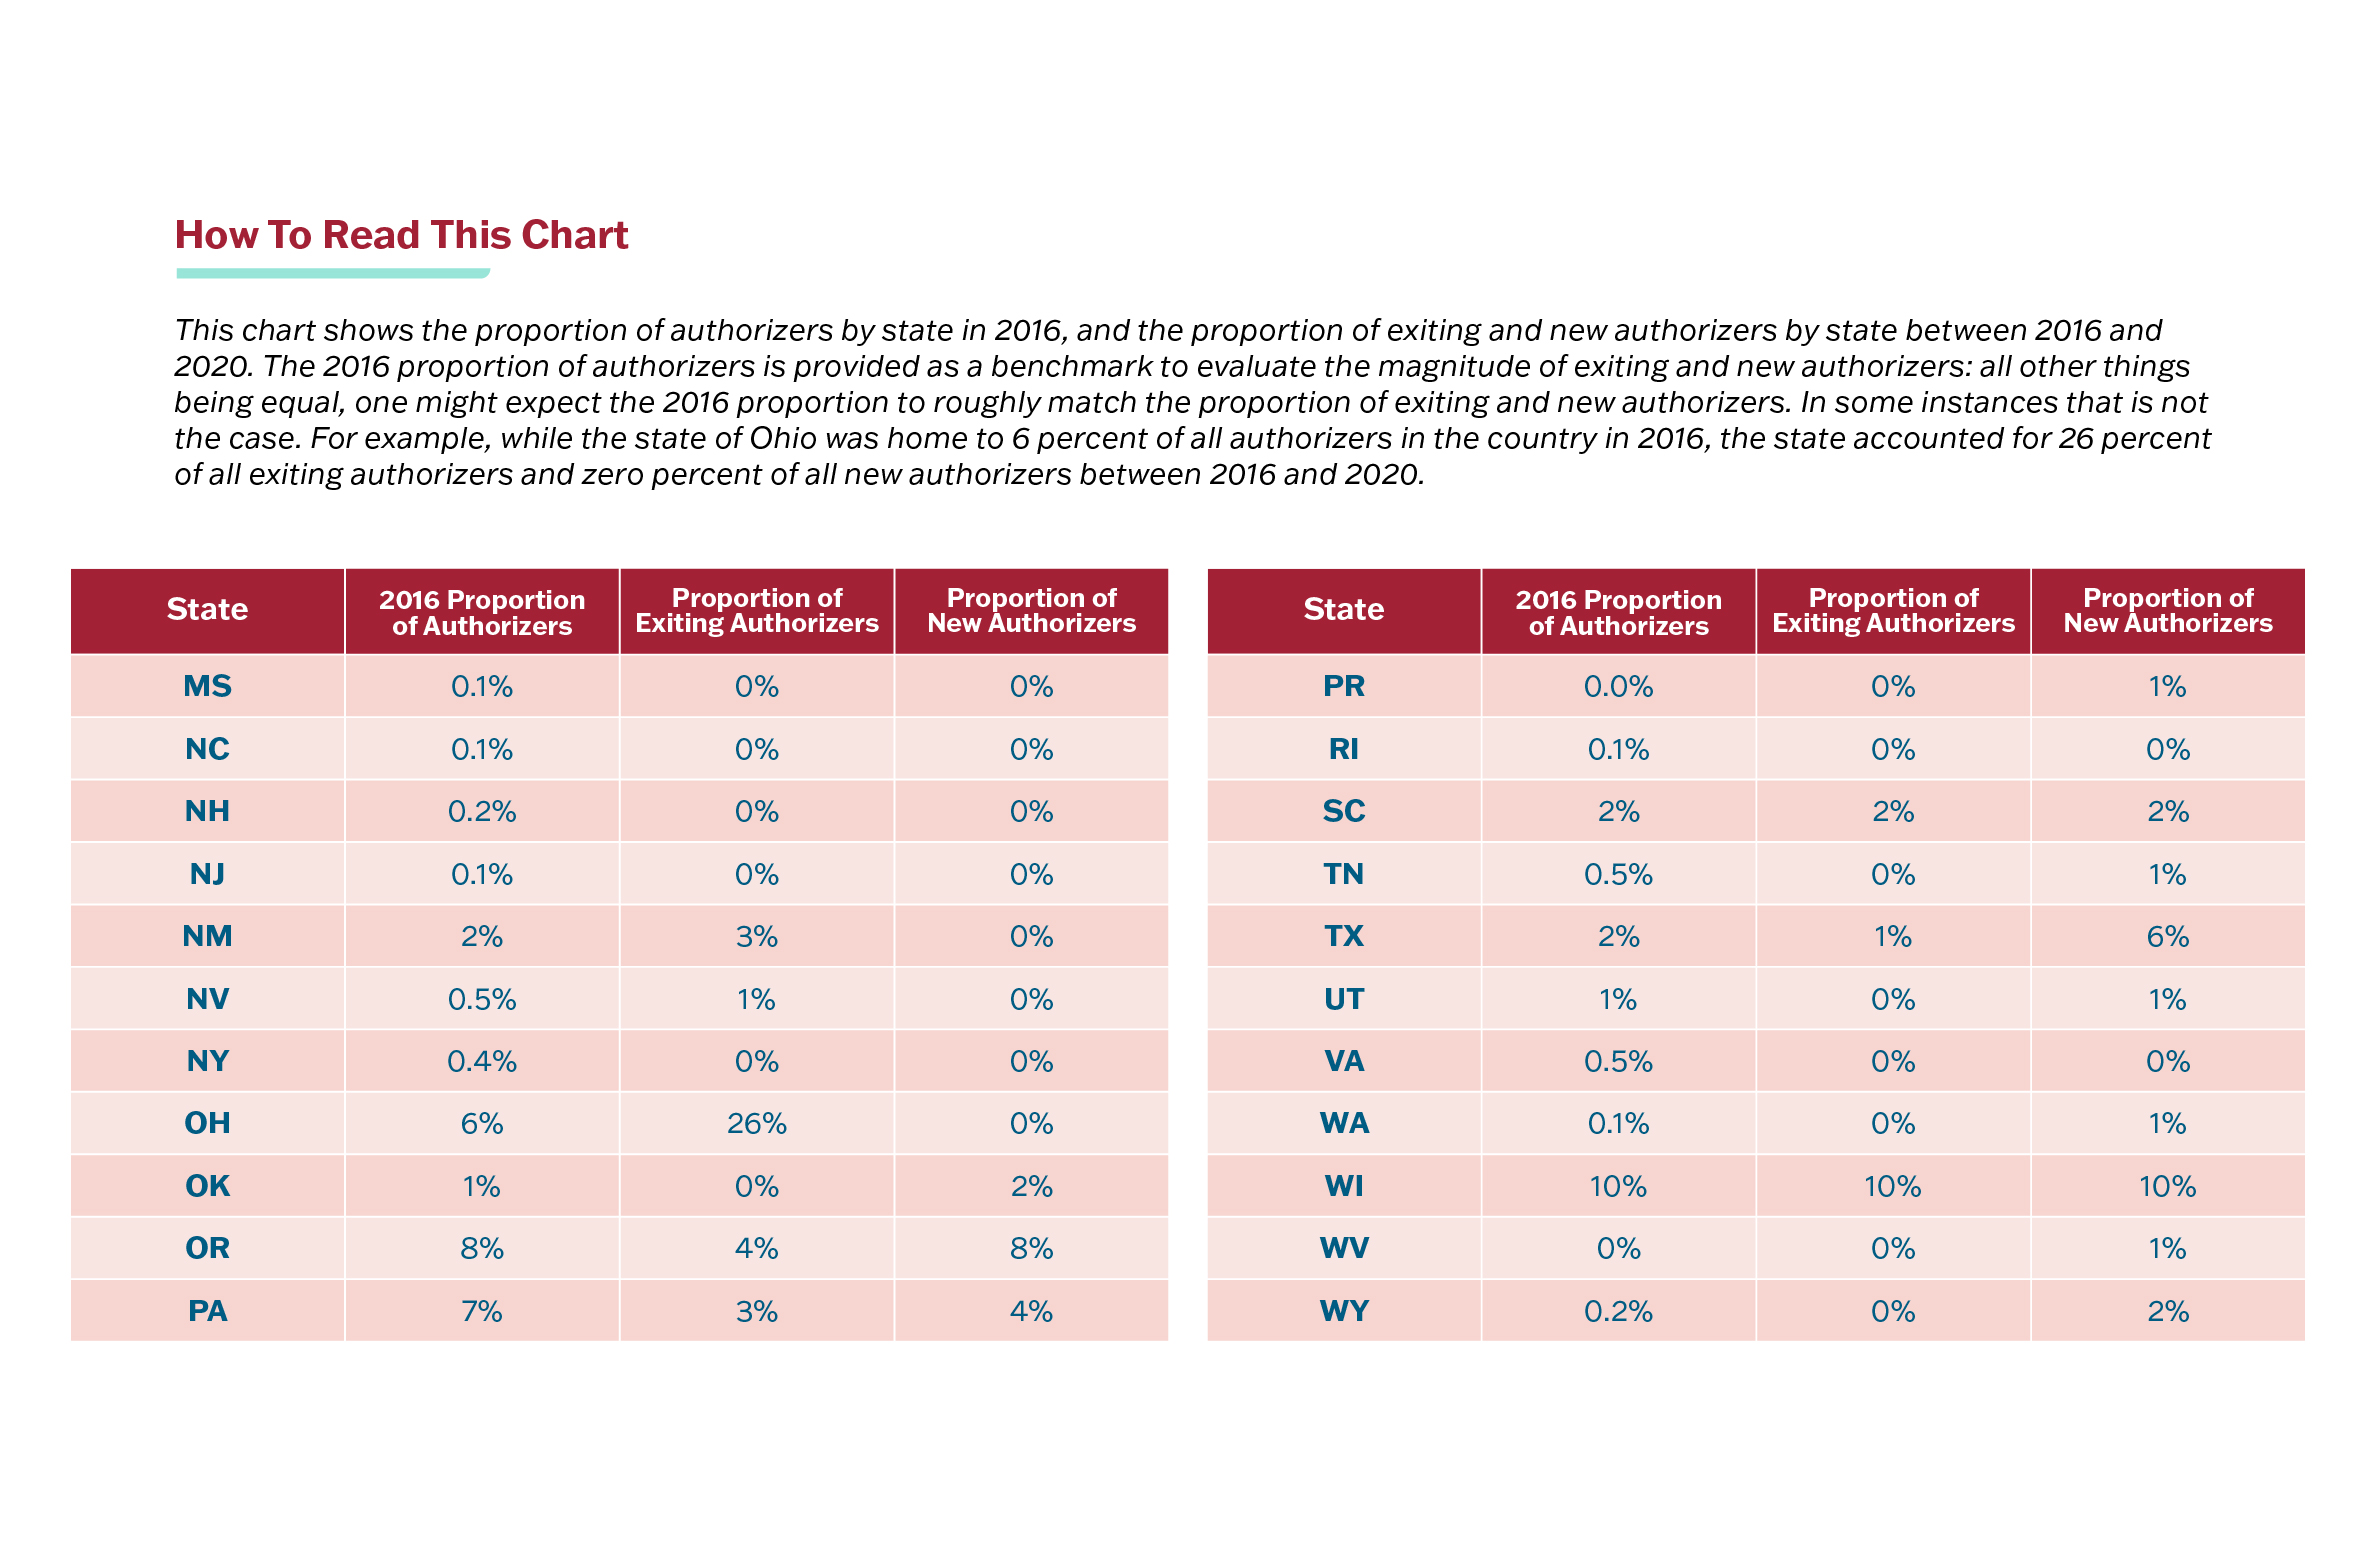
Authorizers exiting the profession oversaw few charter schools: 95% of authorizers exiting oversaw three or fewer schools, including more than three-quarters that oversaw only one school. Exiting authorizers also seem to be disproportionately confined to just a few multi-authorizer states, including places that implemented state policies designed to evaluate and strengthen authorizing, like Ohio and Minnesota.
Number of Schools Overseen When Exiting (2016-2020)
Changes in Authorizing (2016-2020)
Changes in Authorizing (2016-2020) Continued
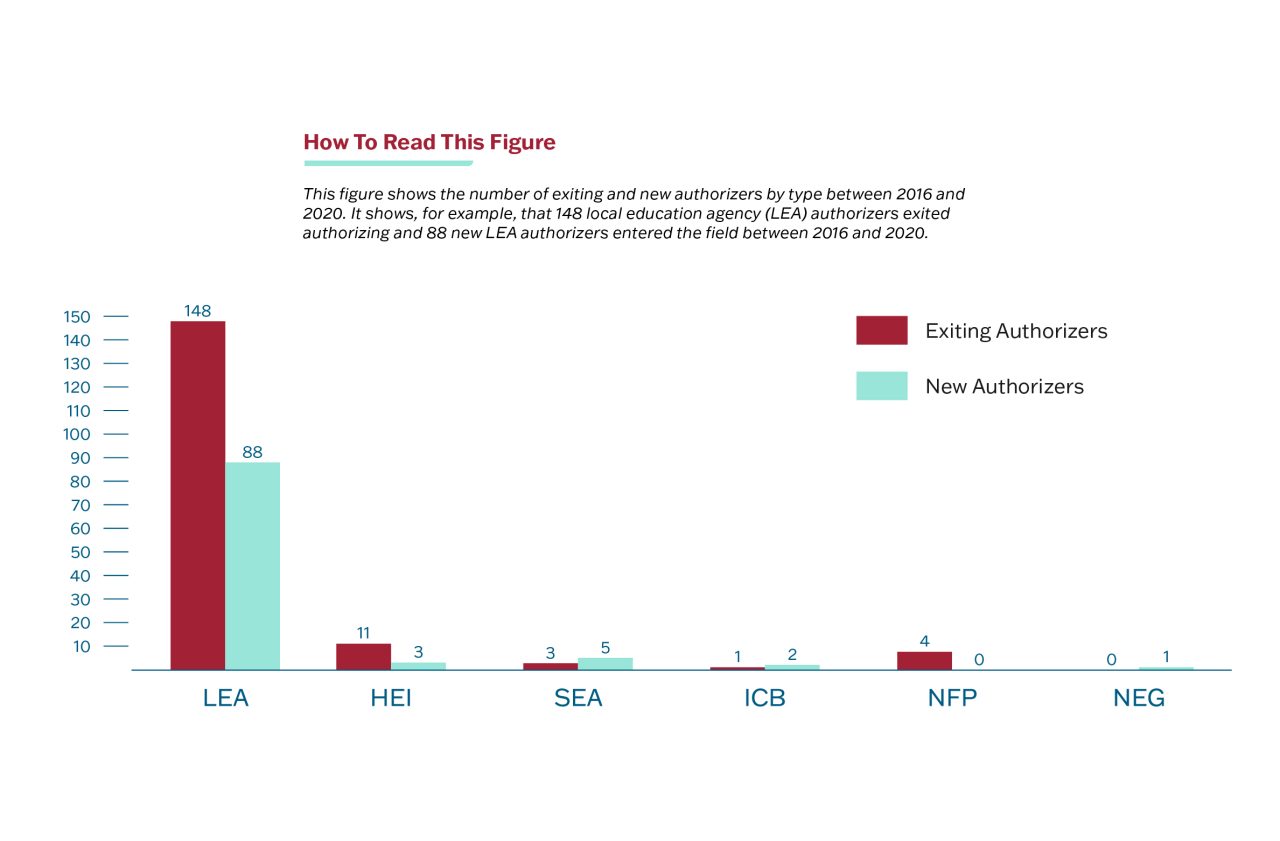
There is churn among school district authorizers.
The vast majority of institutions leaving and entering authorizing are school district authorizers overseeing few charter schools.
Changes in Authorizing: New & Exiting Authorizers by Type
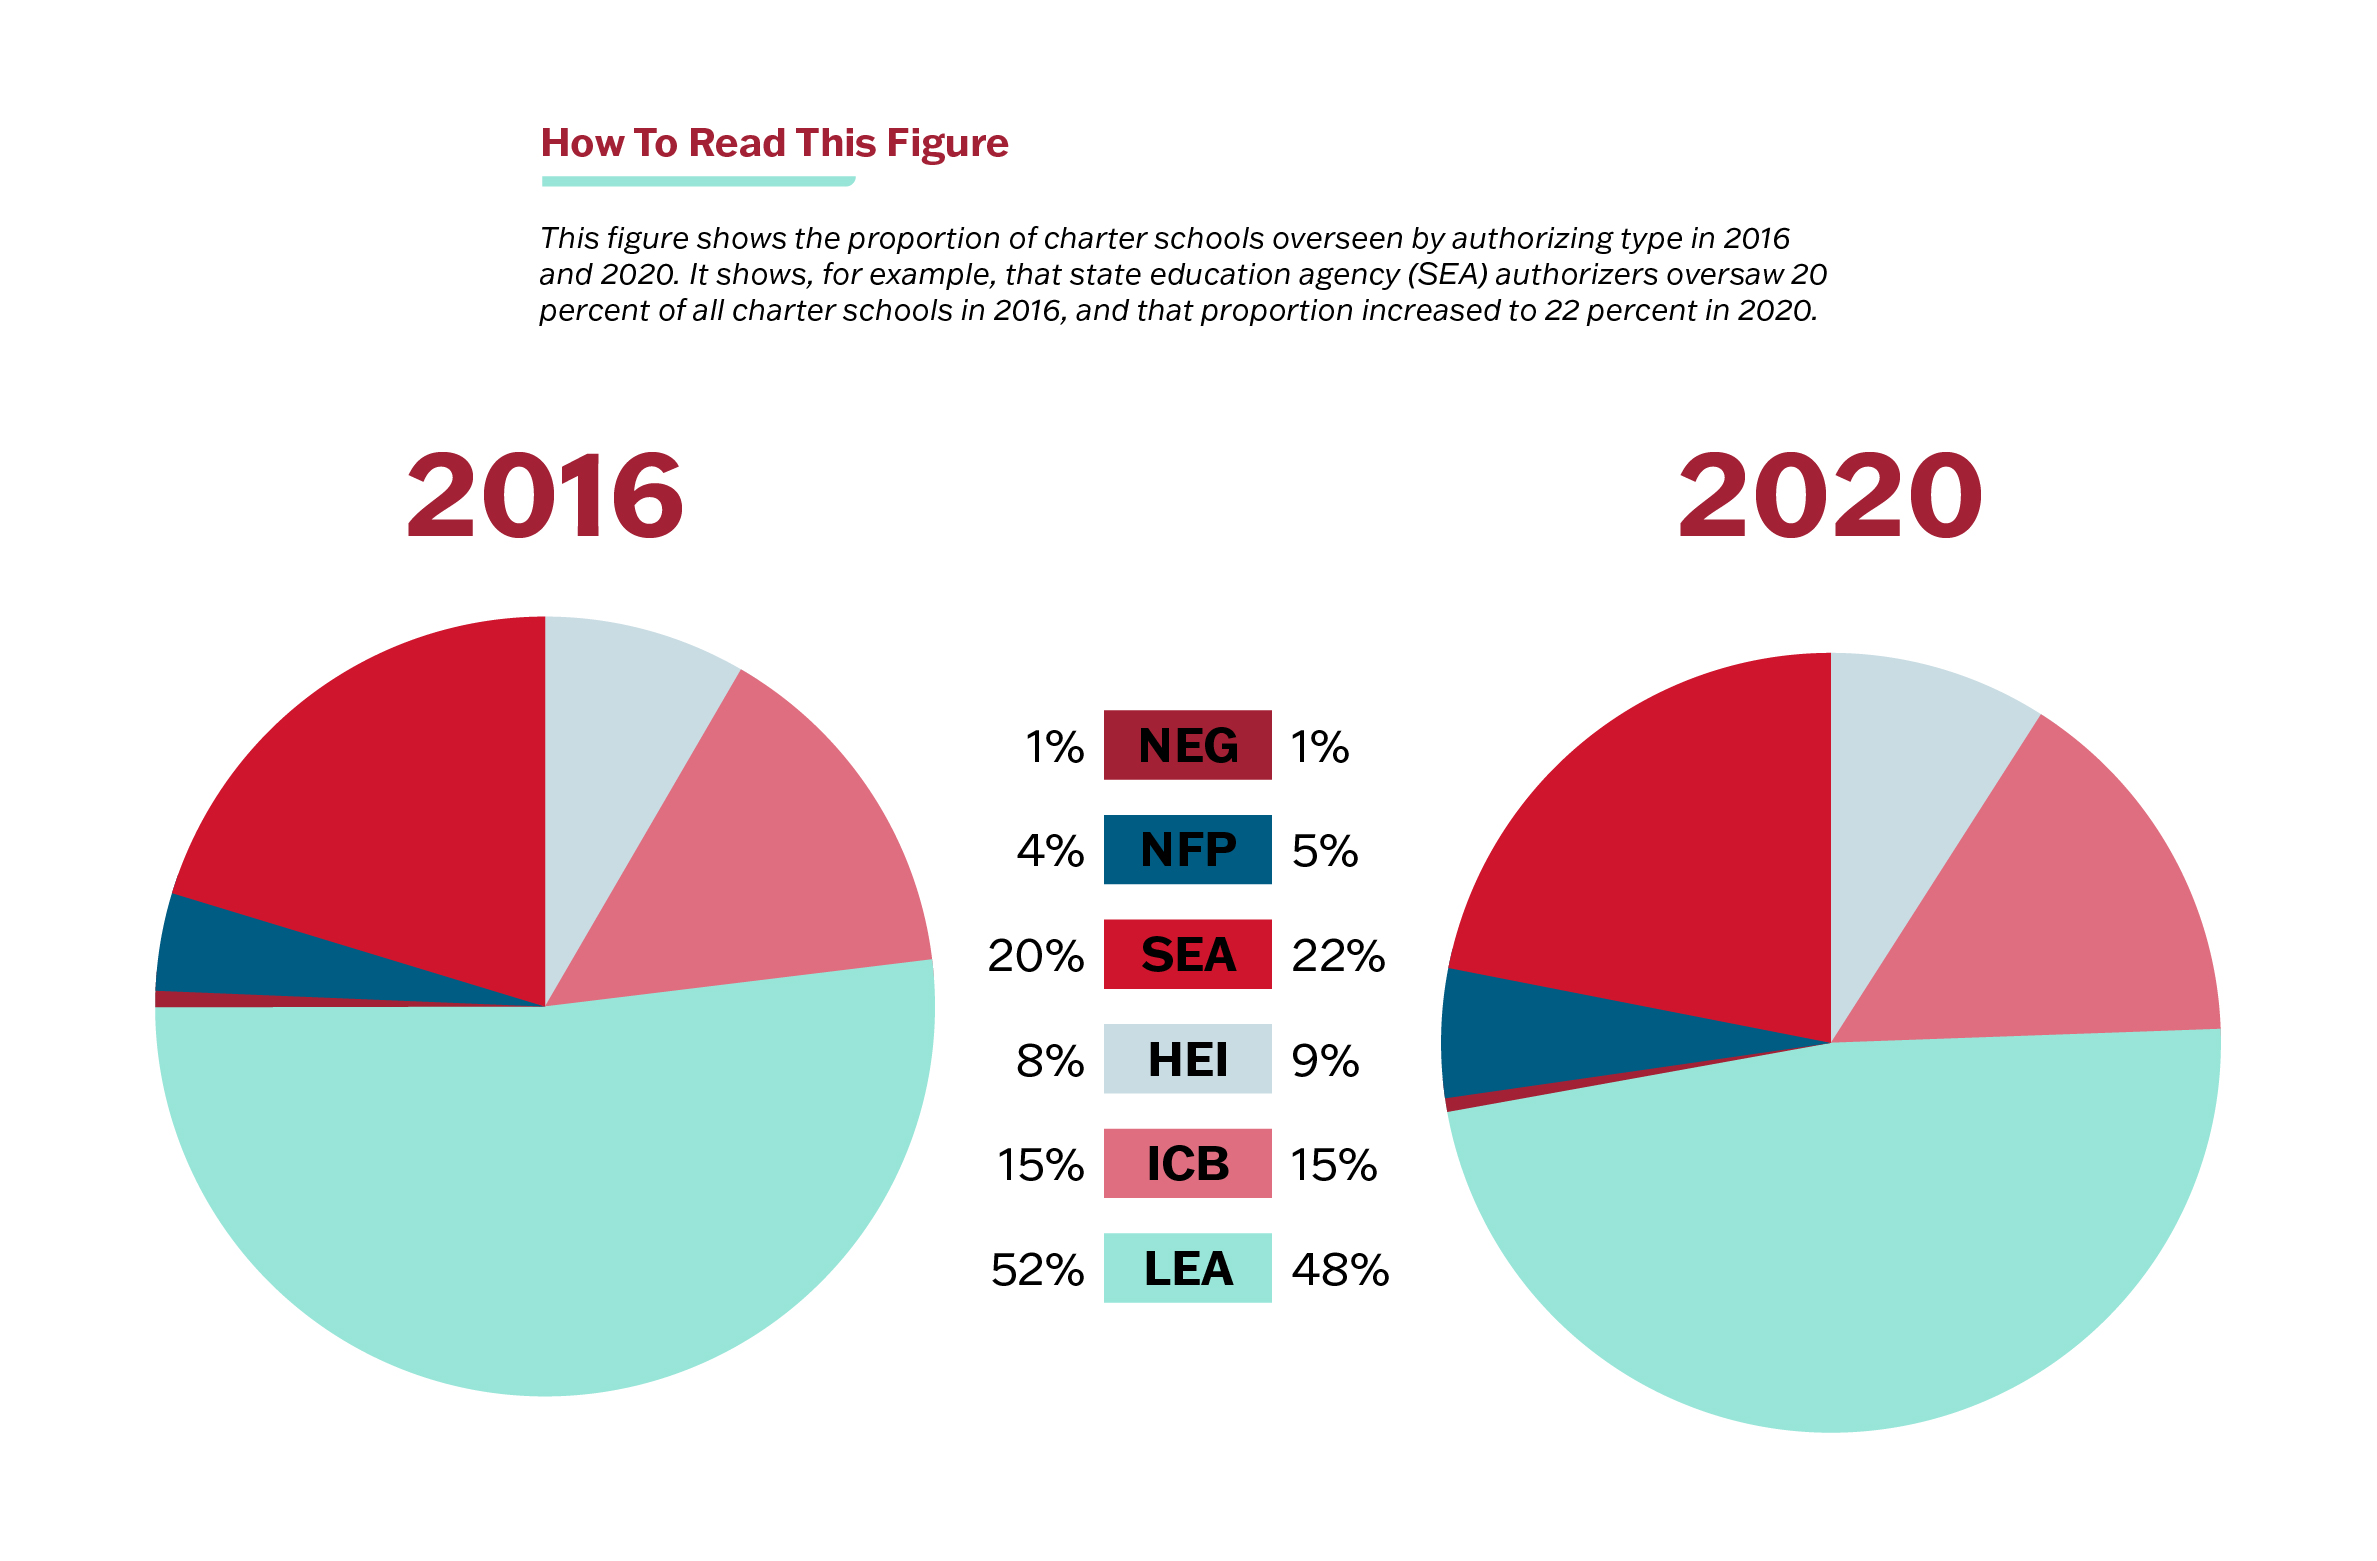
While school districts remain the biggest group of authorizers, the data also shows that they do not oversee the majority of our nation’s charter schools: only 48% of all charters were overseen by districts in 2020, down from 52% in 2016.
Number of Authorizers by Type
Proportion of Schools Overseen by Type
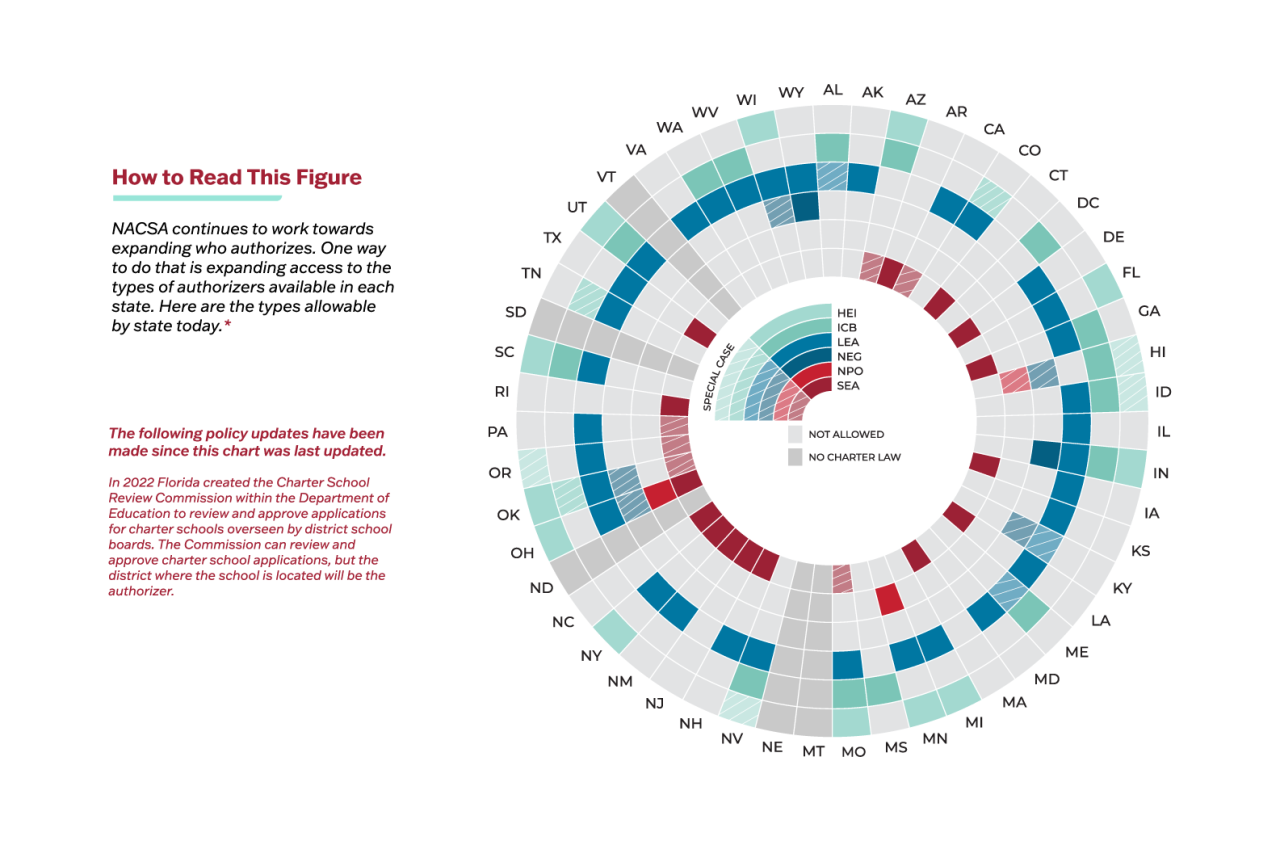
As high-quality charter schooling expands, innovative thinking about who authorizes could be key to expanding quality opportunities for students.
NACSA will continue to support policies that enable potential charter schools to have access to more than one quality authorizer within a state, along with policies and practices ensuring that multiple authorizers do not dilute quality. Interesting ideas like specialized authorizing focused on new ways of organizing teaching and learning, not only can provide high-quality, innovative, and equitable educational opportunities, but may also lead to a more diverse, thriving profession resulting in stronger student outcomes.
New Opportunities for Authorizing
THE IMPACT OF THIS RESEARCH
Over the coming months, we will explore these and other key themes more deeply to extract key learnings for authorizing, policymaking, and other school oversight approaches. Be on the lookout for additional data, perspectives, webinars, and more.
We’ll also discuss the impact of this research at our upcoming leadership conference, NACSACon 2022: Excellence from Communities. If you haven’t already registered, it isn’t too late! Come and be part of some fascinating and inspiring conversations as we build the future of authorizing.
We spend plenty of time talking about the why and how of our work, as we seek to ensure more high-quality, innovative, and equitable educational opportunities for children. But every few years, it’s critical that we also talk about the who. Who is doing the work of charter school authorizing today, how is that changing, and why does that matter?